We were wrong about convergence
Several years ago, we celebrated a new era of unconditional convergence of global incomes. Since then, the trend has reversed.

Bob Solow’s original 1956 formulation of the neoclassical growth model predicted that poorer countries would grow faster than rich ones. Capital flows—from rich to poor— would be the great leveler. Three decades later, the advent of the Penn World Tables gave economists access to comparable cross-country data to test that hypothesis rigorously. It proved false. From the 1960s through the 1990s, the opposite was true, per capita GDP levels were not converging as predicted—and if you rolled the clock back even further in history, it was obvious rich countries had been getting richer for quite a while.
But then something changed. No sooner had Lant Pritchett announced “Divergence: Big Time” in 1997 than developing countries, for the first time in two centuries, started catching up with the living standards of advanced economies. Belatedly observing this phenomenon, we wrote a fairly giddy piece in 2018 declaring that “Everything You Know about Cross-Country Convergence Is (Now) Wrong.” Convergence had finally arrived.
Alas, the facts have changed again. In this post, we return seven years later to extend our earlier results to the latest data. Just as we heralded the new era of unconditional convergence, as we called it in the journal-length version of our piece, reality came back to undermine our optimistic finding. It turns out, everything you once knew is right again. Soumaya Keynes noted signs of this (second) reversal of fortune last year in the Financial Times. And of course the growth slowdown in emerging markets has been well-documented, as in this note on divergent post-Covid recoveries by Eduardo Olaberria and Carmen Reinhart and this piece by Jonathan Hartley. In sum, unconditional convergence appears to have come to an end – at least by the metric originally used to test Solow’s hypothesis in the 1990s, and it appears to be slowing down although not necessarily reversing by other measures too.
The harder question is, why? Our answers are pretty speculative at this point, but first, the basic facts.
Everything we told you about convergence is (now) wrong
The figure below presents our headline result. We use the newest releases from three different sources of income data: the Penn World Tables (PWT), the World Bank’s World Development Indicators (WDI), and the Maddison series.
Following the same non-linear specification as Barro and Sala-i-Martin (1992) and as our own earlier paper, each dot captures a convergence coefficient for per capita income, essentially just regressing growth rates on initial incomes. The time period varies along the horizontal axis, always covering a 10-year span. In this formulation, positive numbers mean that poor countries are catching up to rich ones, or in other words, that the lower your initial income, the faster you grow.
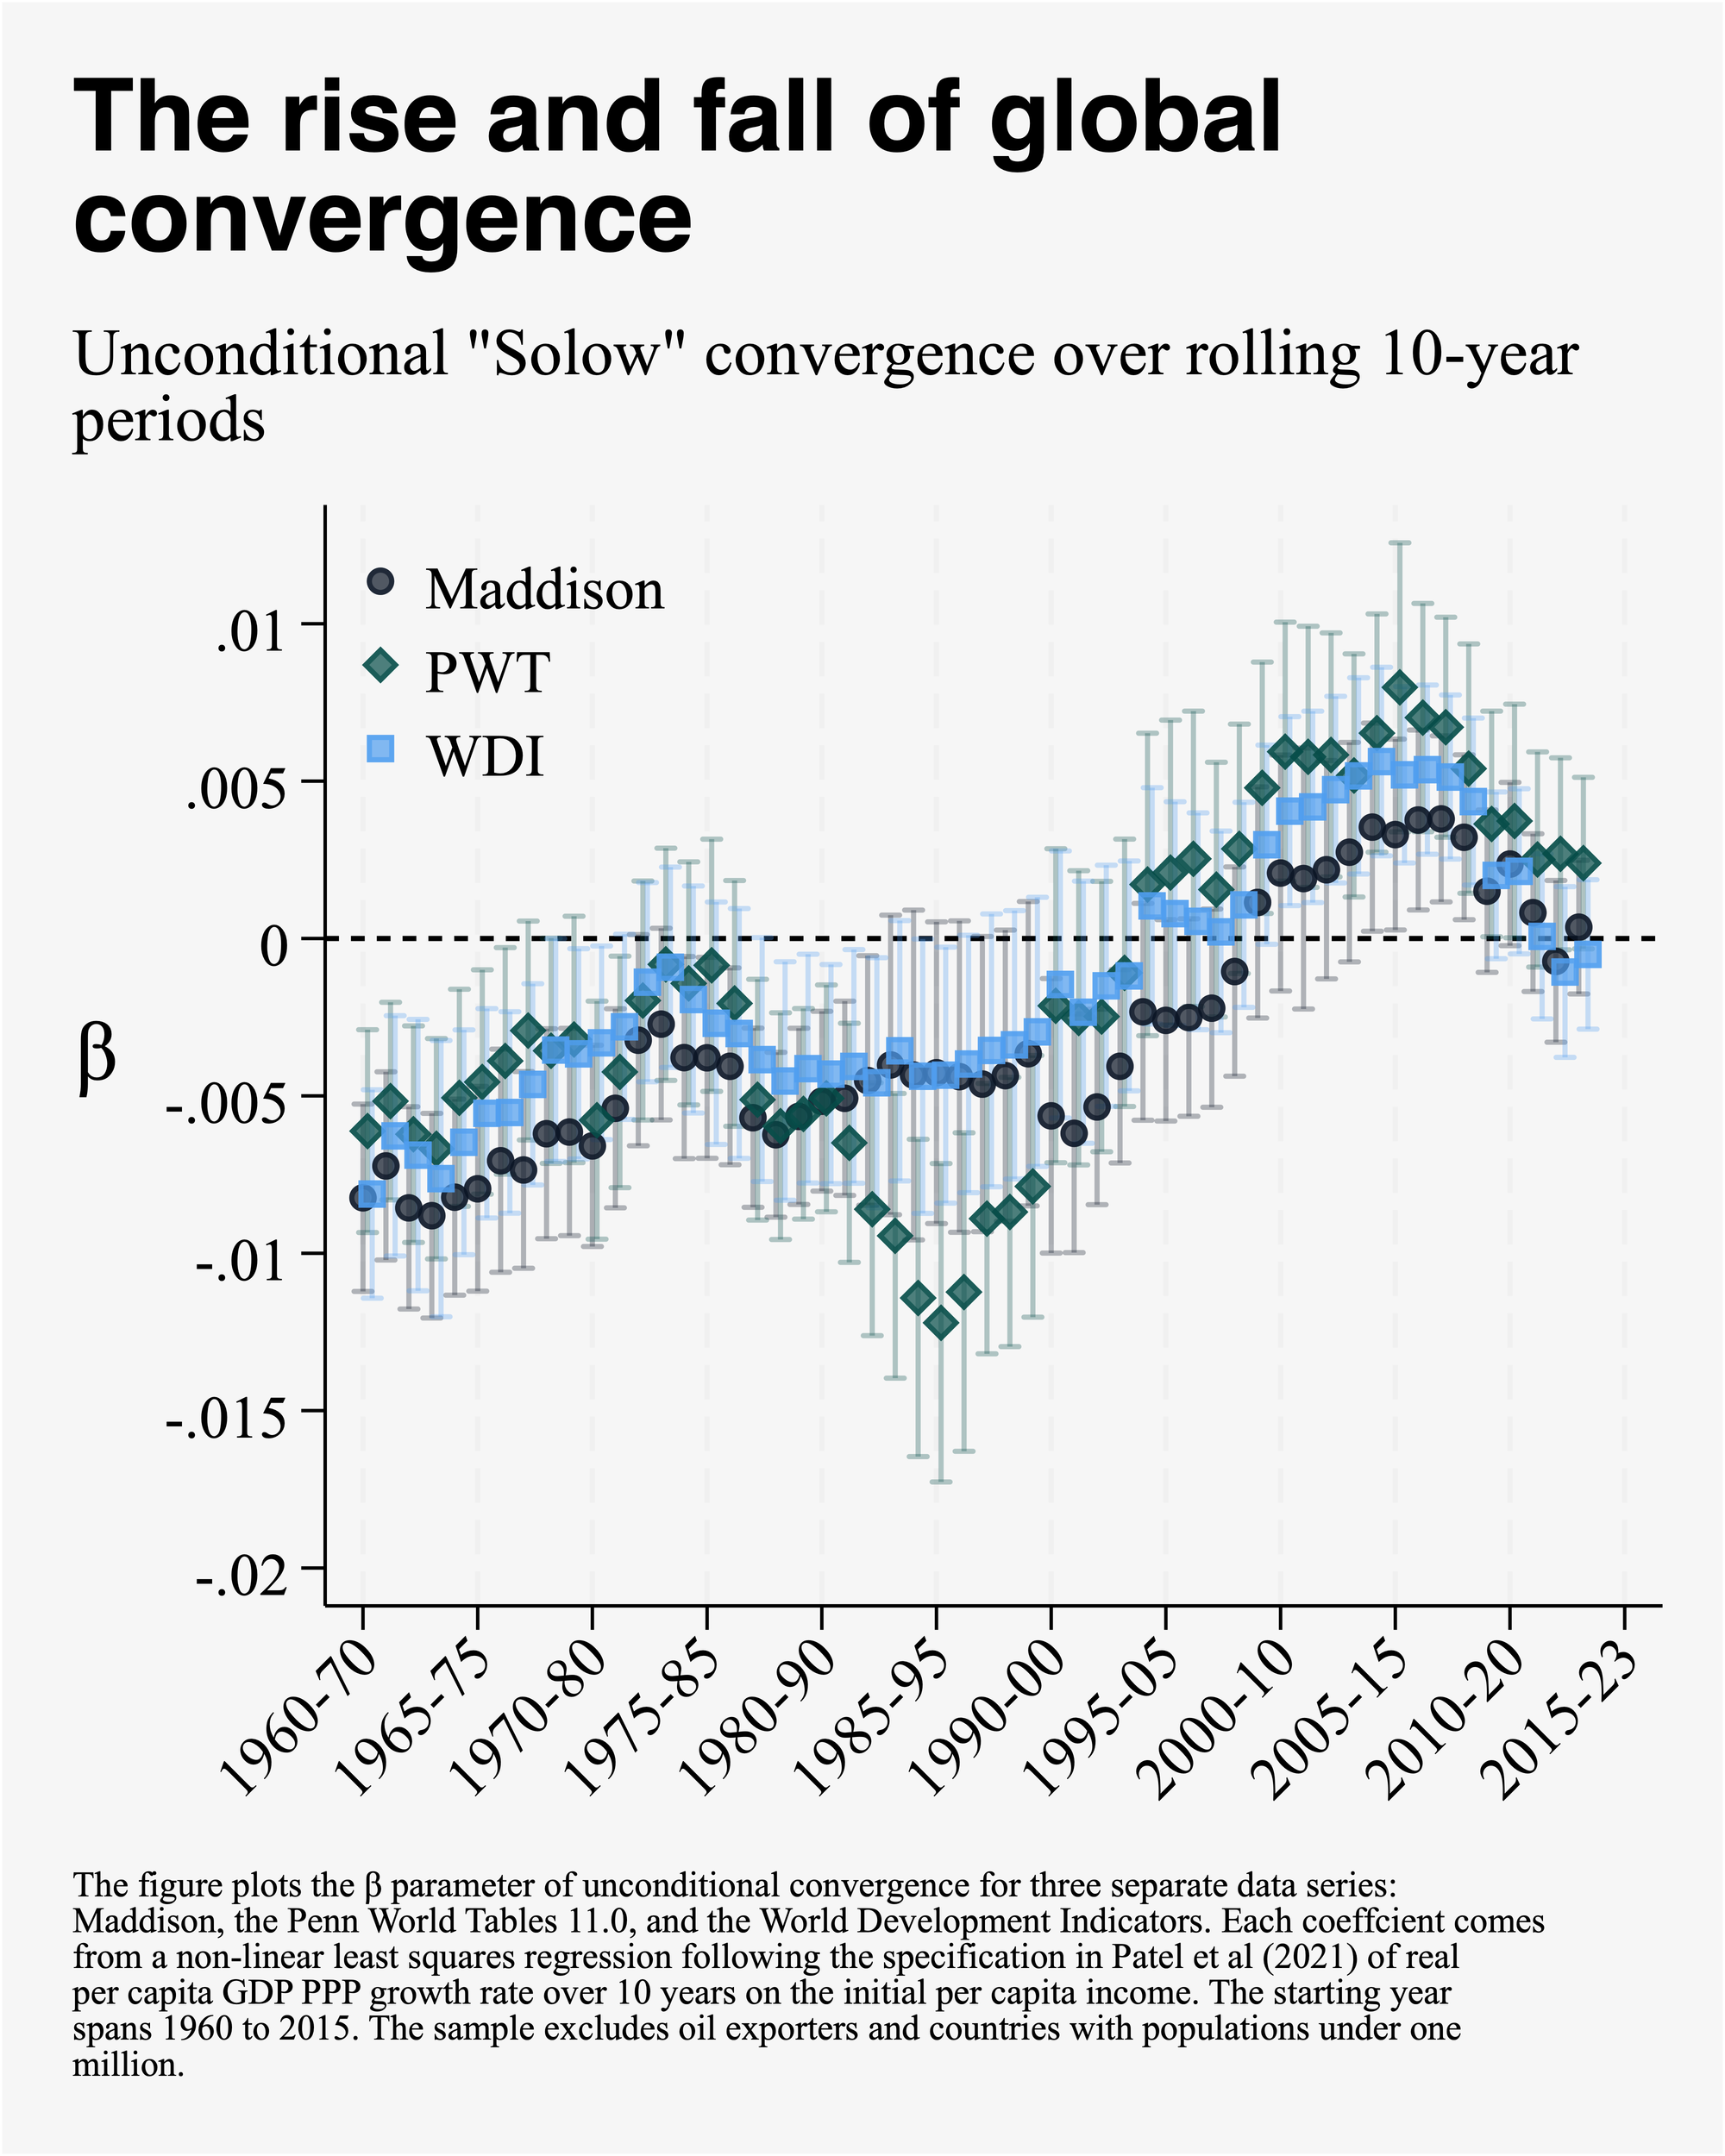
The original story of divergence then convergence remains the same, despite the scope for the revised data to alter results. For the three decades leading up to the empirical literature on economic growth, the gap between developed and developing nations expanded.
That all started to change around the fall of the Berlin wall, and poor countries went from lagging behind richer ones to maintaining pace with and then ultimately to growing faster resulting in convergence.
The latest data updates show that that golden era of relative prosperity has come to a halt. In the past decade and a half, there is no evidence that poor countries have grown faster than richer ones.
The share of developing countries growing faster than the G7 is falling fast
So far we’ve shown that poorer countries only grew faster than richer ones on average for about 20 years. But that is not the only way to think about the notion of economic convergence. Roy et al. (2016) proposed an alternative metric of convergence that focuses less on averages, drawing inspiration from Oscar Wilde: “We are all in the gutter but some of us are looking at the stars.” "Wilde convergence”, as Roy et al call it, simply measures how many poor countries are catching up with the frontier, namely the richest countries.
That share remains quite high, though it is falling fast.
To see this, define the frontier as the average growth rate among the G-7. Also, because World Bank definitions change arbitrarily over time, we categorize countries as "low income" or "middle income" if they fall below the 25th and 75th percentile, respectively, of U.S. income in each year.
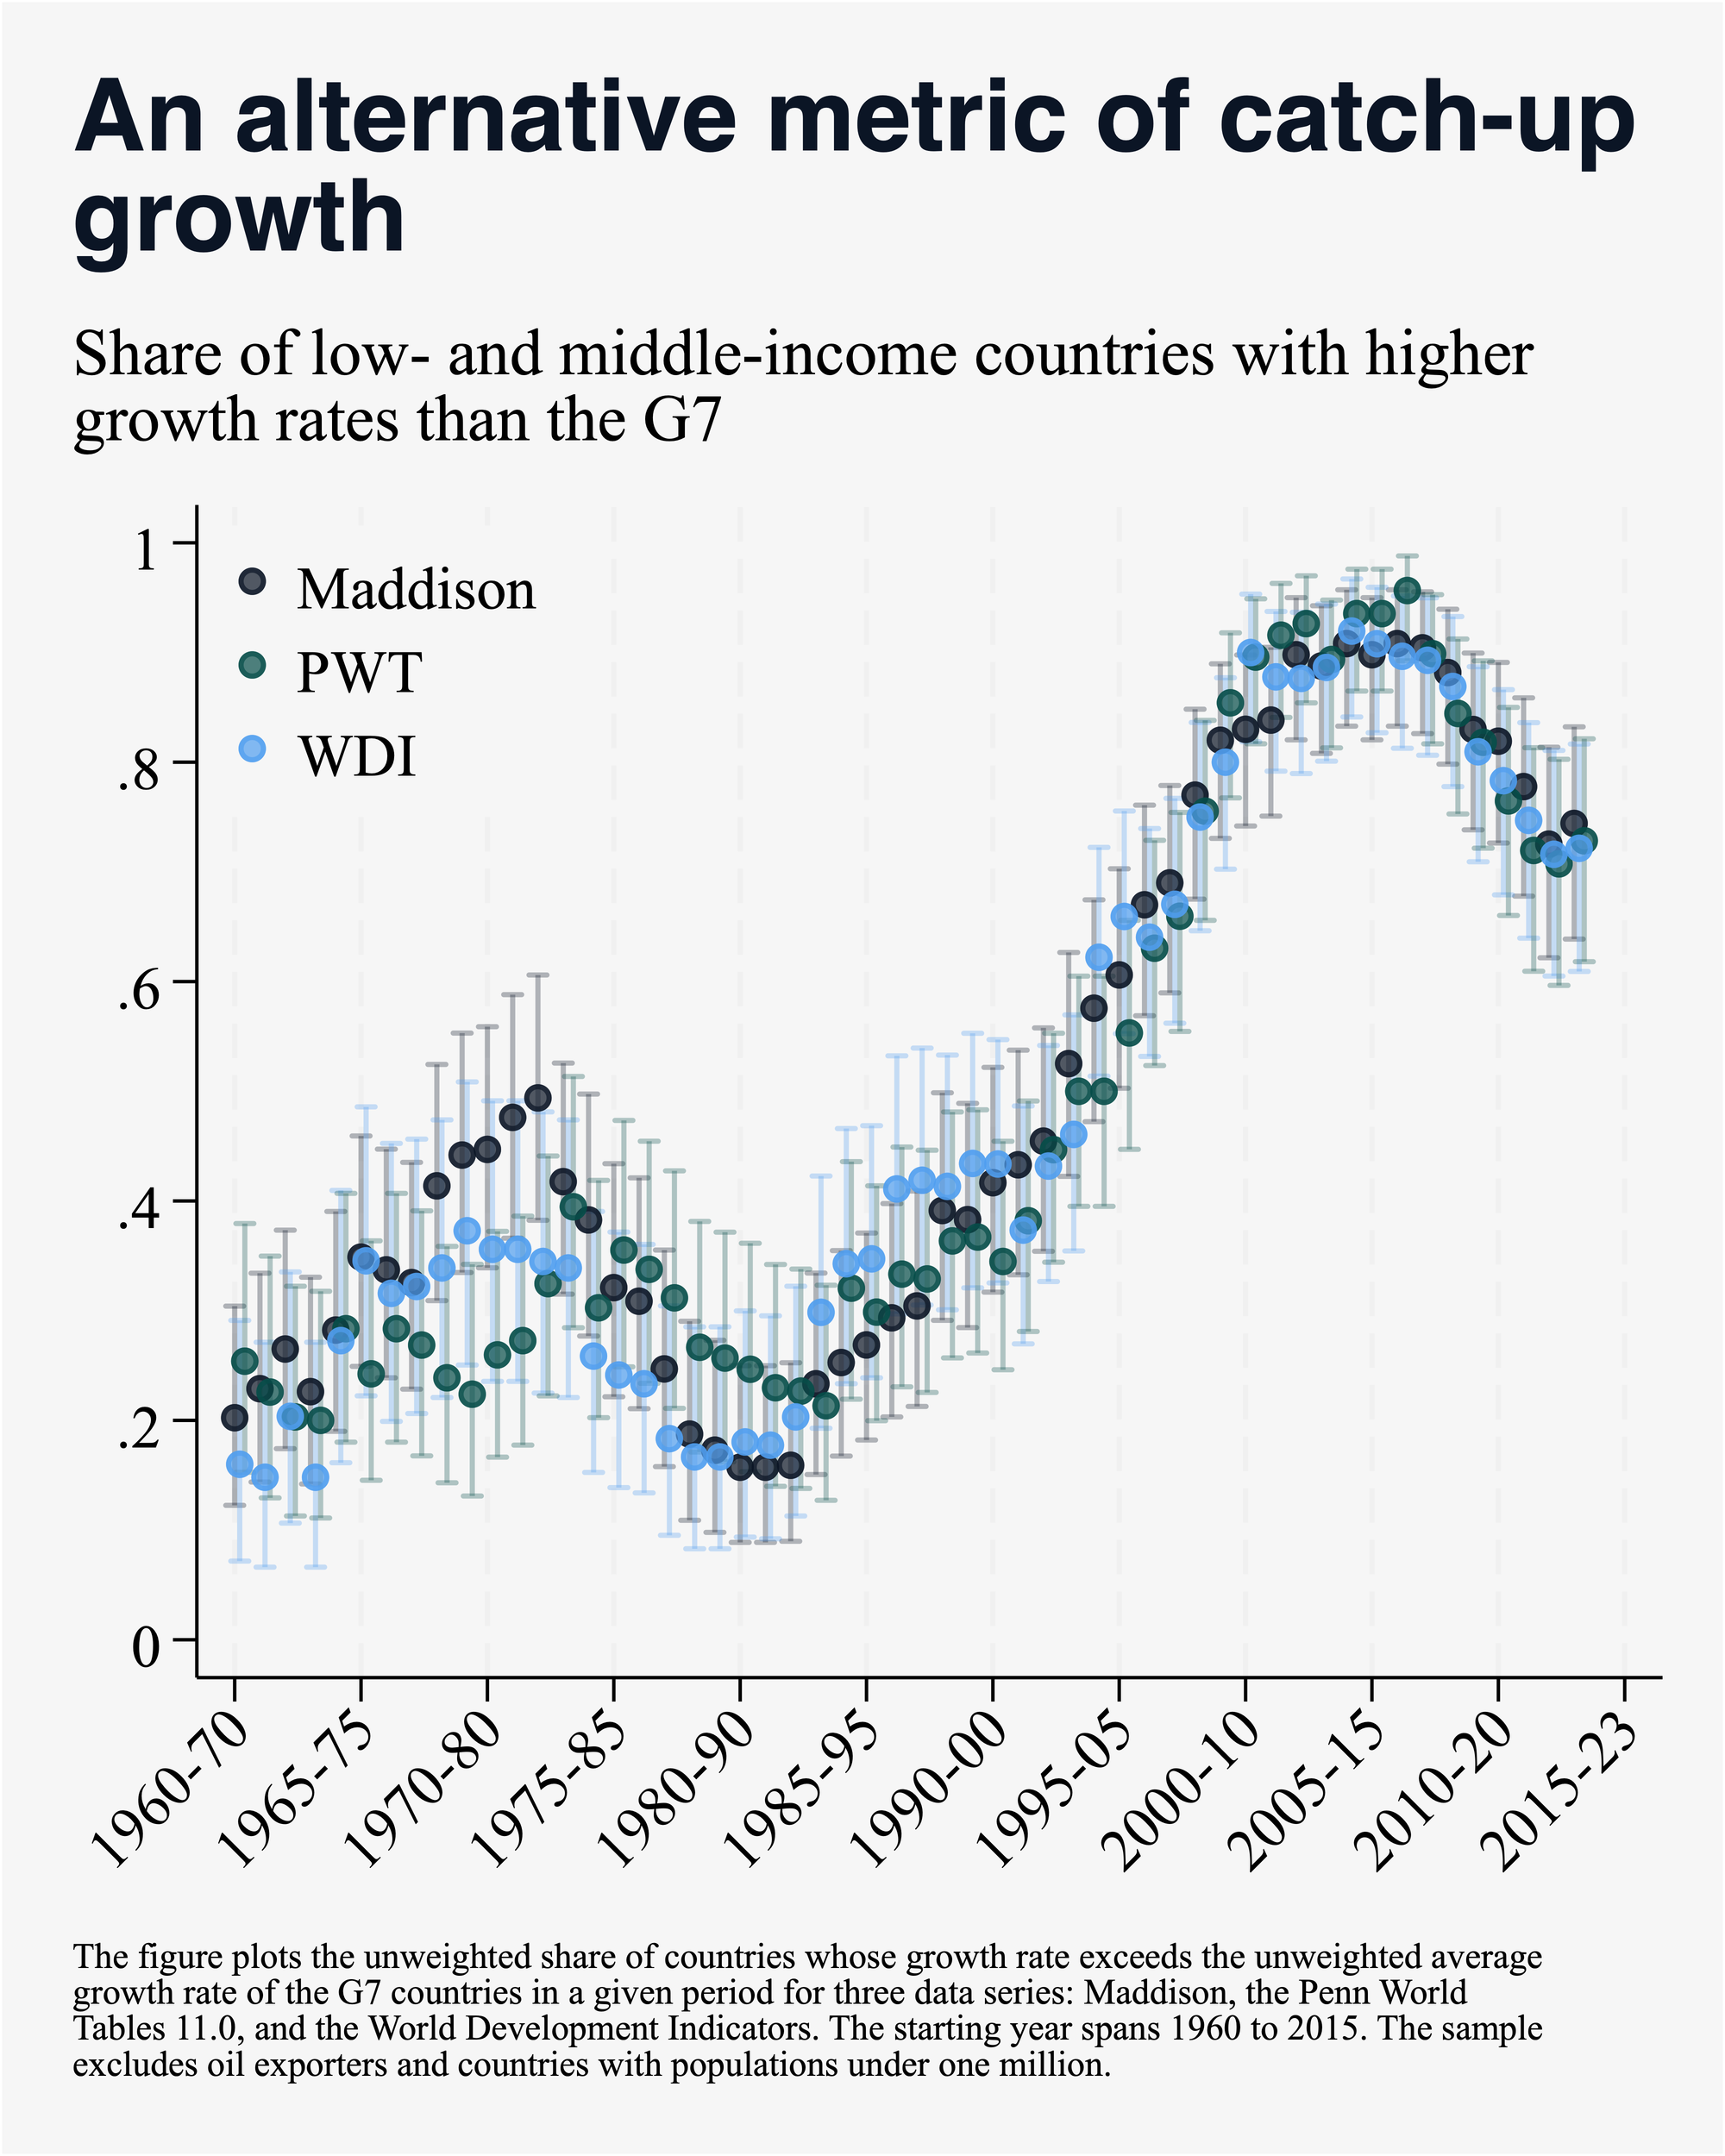
The results are striking. Prior to 1990, all three data sources show that less than half of developing countries are exceeding this frontier growth. But in the same period that Solow-convergence begins, “Wilde-convergence” takes off with a fury. By 2000, nearly all low- and middle-income countries grow faster than the G-7. While the last 15 years have exhibited a decline in this rate, nearly three out of four developing countries still are achieving gains in income above the rich-country frontier.
This poses a puzzle: if 70 percent of poor countries around the world are growing faster than the G7, why are we not seeing Solow convergence? One answer is that although the number of developing countries still converging to the rich world is high, the pace of catch up has declined sharply. At the peak, Asia outpaced the G-7 by over 4 percentage points annually which declined to just below 3 percent recently. In contrast, countries in Africa and Latin America that were outpacing the G-7 by nearly 2.5 percentage points are now doing so at a much slower pace, resembling the period of divergence. It is slowing growth in these 2 regions that accounts for the demise of Solow convergence.
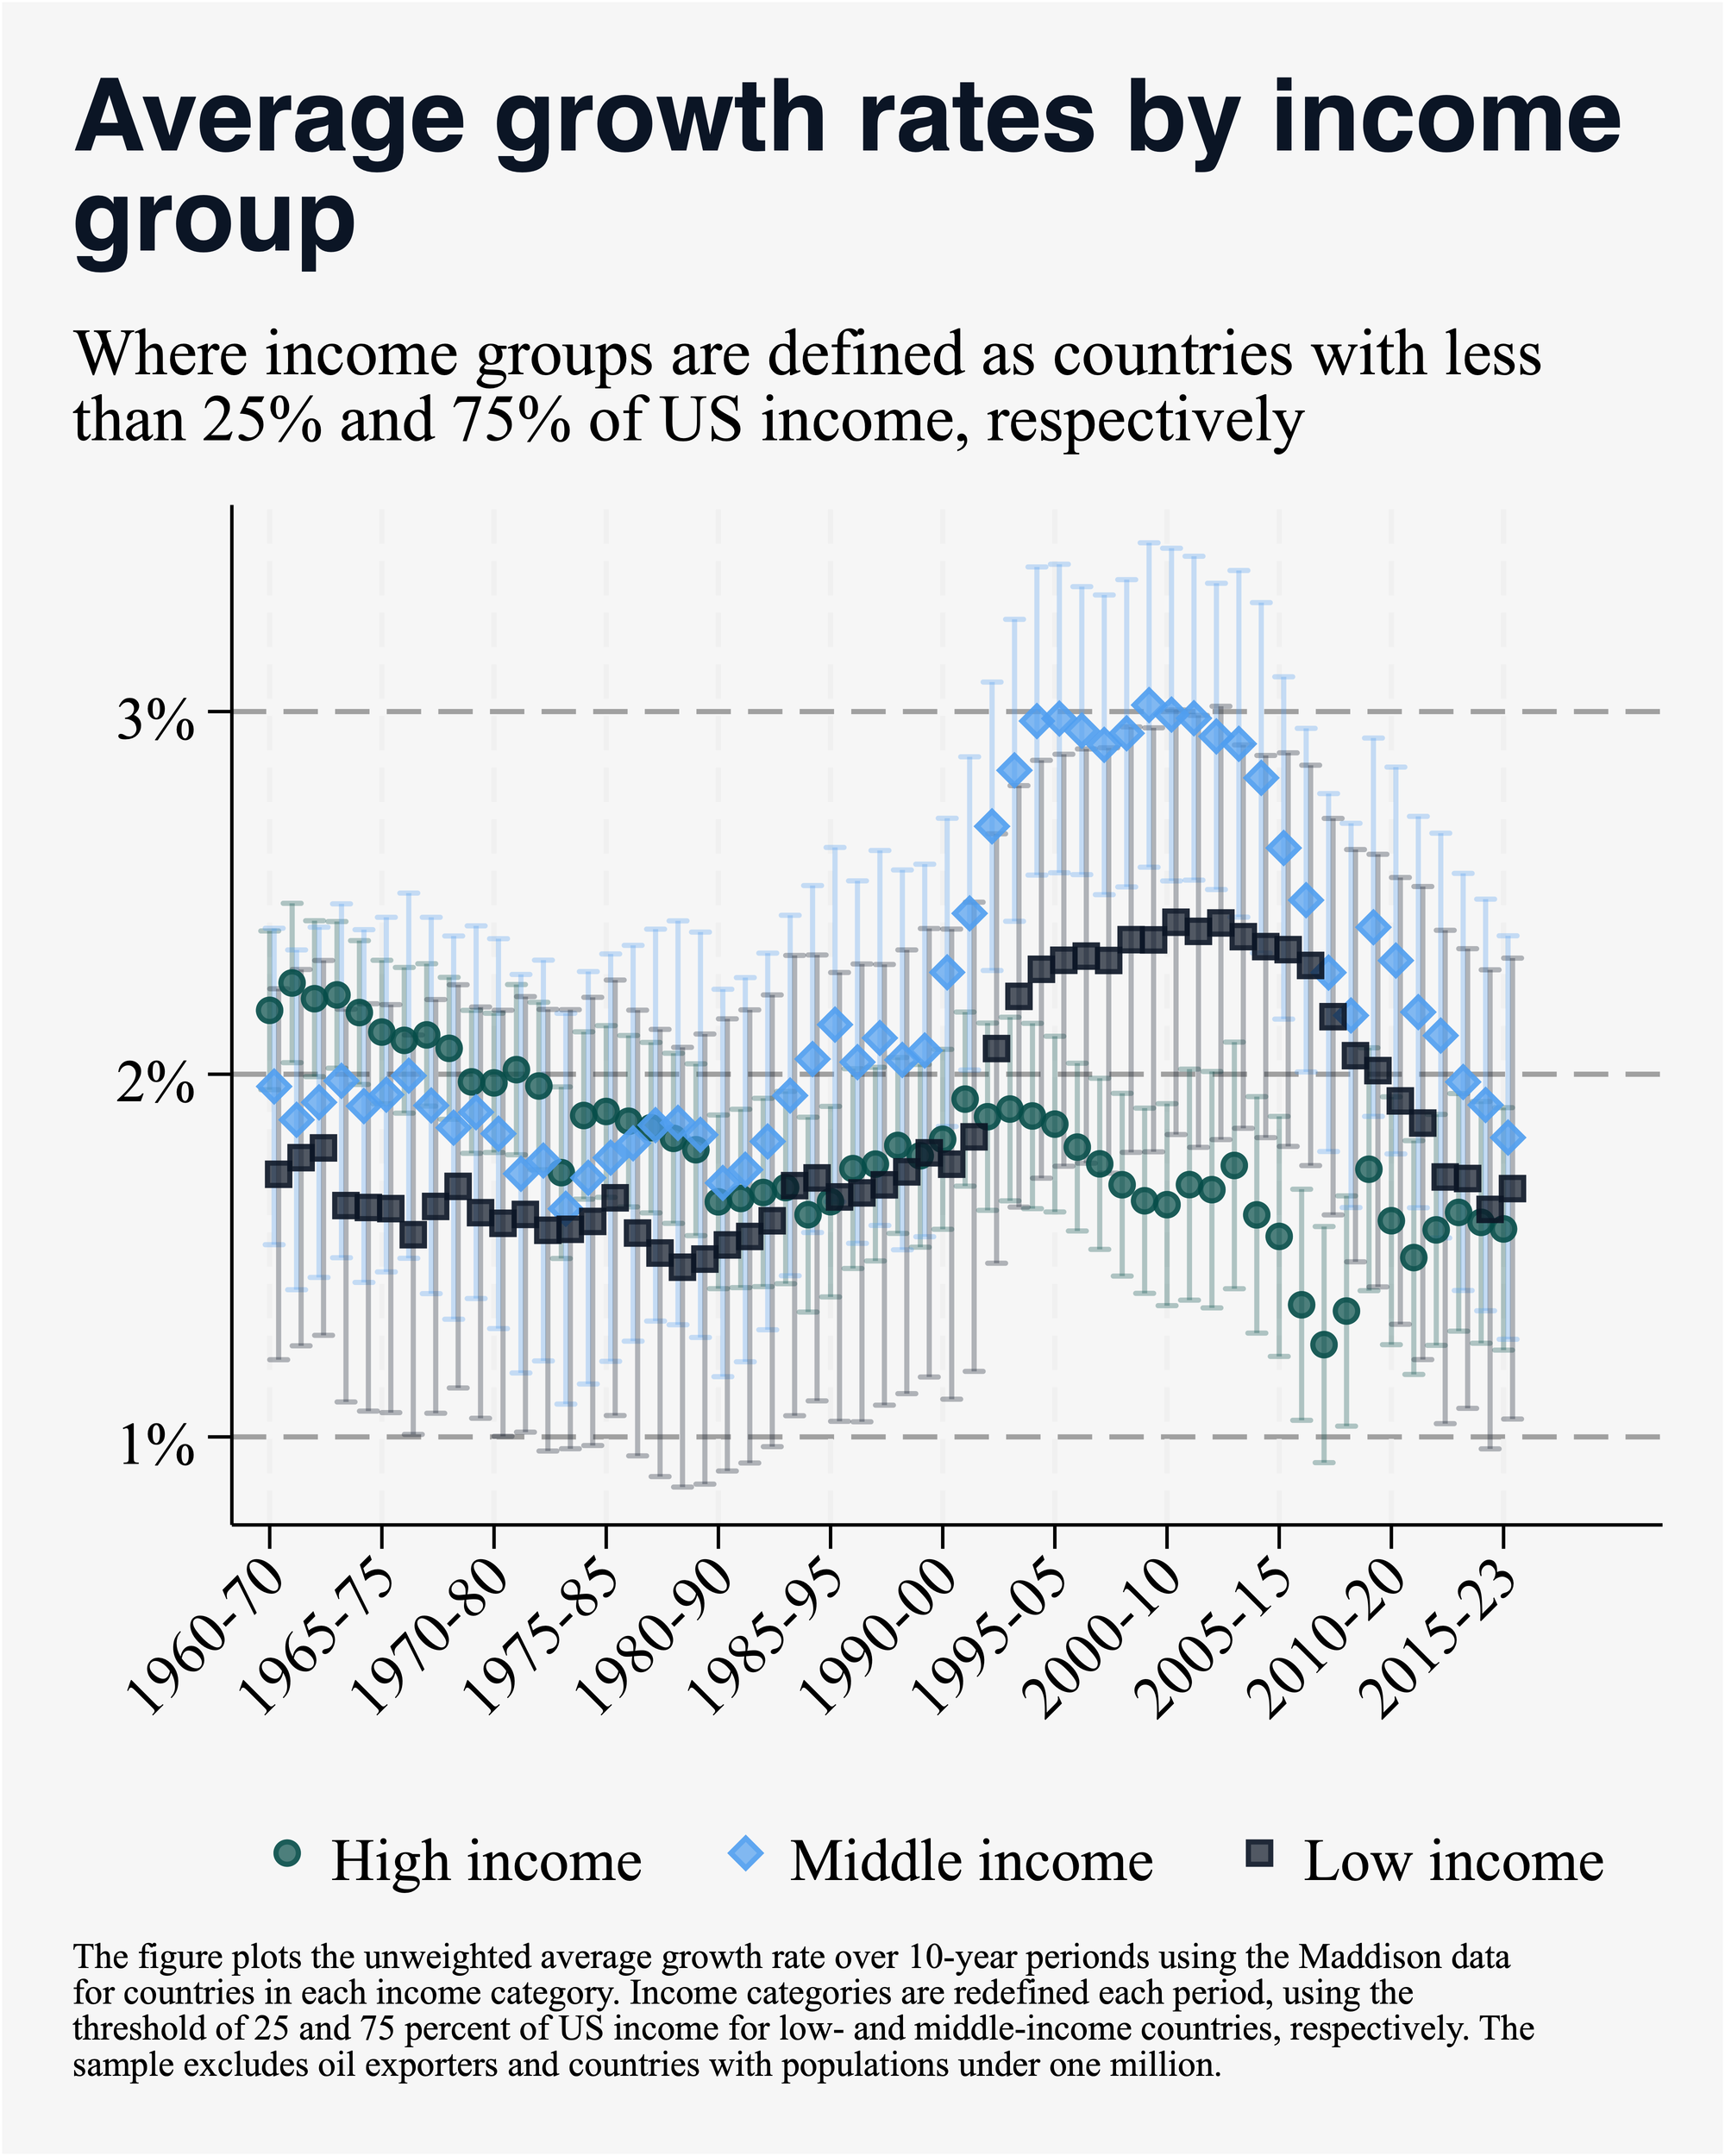
Another part of the answer is that Solow-convergence is an average result across all poor countries scaled by initial income: if some middle income countries grow faster than low income countries convergence could be obscured, even though both grow faster than rich countries. Indeed, the data show middle income countries grow faster than either other group – a middle income “trampoline” rather than a trap – which dampens Solow convergence, as shown by the 2000s spike among the black diamonds representing middle-income growth rates in the graph below.
A third explanation is that rich countries are growing faster than in the 2010s so that the average gap between rich and poor as a whole has declined.
The figure below illustrates both the second and third of these mechanisms, showing the raw data on growth between the start year on the x-axis and the latest available year. They illustrate that after the mid-2000s, global financial crisis growth in low and middle income countries declined while still substantially exceeding growth in high income countries. But after the 2010s, the decline has been dramatic, which combined with a slight improvement in HIC growth rates has led to the elimination of convergence. What happened?
Why did convergence slow down?
We'll leave a detailed econometric investigation of that question for another day, but we can't resist a couple of preliminary conjectures. In a Foreign Affairs piece last year, we argued that "hyperglobalization" was a key driver of convergence.
“In the era of rapid growth, nearly every country expanded trade. Most famously, China and India—followed by Vietnam and Bangladesh—experienced economic-growth miracles on the back of rapid growth in their exports and trade, in manufacturing in the case of China and East Asia and in services in the case of India. Commodity exporters, especially in sub-Saharan Africa, benefited from a surge in commodity prices, itself induced by China’s rapid growth and its voracious demand for oil, copper, iron, and other minerals.”
With hyperglobalization stalling, especially for low and middle income countries, it is not surprising that so too has convergence.
Convergence was accompanied by rapidly rising trade (hyperglobalization) until around the 2008 Global Financial Crisis. Thereafter, trade as a share of GDP has either levelled off or declined in both low- and middle- income countries. This decline was dramatic for some larger developing economies such as China (which say a 20 percentage point from 2008 to 2023) and Indonesia (a 17pp drop). Indeed, high income countries do not seem seriously affected by the end of hyperglobalization which seems to have disproportionately affected developing countries.
But is there something much bigger going on? In that same piece, we argued that another key driver of convergence was a turn toward markets but more fundamentally that a majority of developing countries began to follow a variant of U.S. President Barack Obama’s famous foreign policy dictum: “Don’t do stupid shit.” The question is whether that has now been reversed. We do not have the space for identifying a long list of what would constitute such a reversal but a more common global change in institutions, especially political ones, seems evident in the past decade. The world has become more illiberal, majoritarian and nationalistic, reflected in perceptible democratic backsliding. One commonly cited indicator of democracy, the V-dem index, has stopped the gains it enjoyed at the onset of the Solow-convergence era, with particularly marked declines in the middle- income countries that have seen the sharpest decline in growth and globalization.
Of course, the links between weak political institutions/illiberalism and economic outcomes are tenuous at least over short horizons, but there are connections that are striking. In China, the nationalism and illiberalism under Xi Jinping has been associated with a crackdown on private sector entrepreneurship that produced frontier technologies and services. In India, the weaponization of the state against political opposition has also been directed at domestic and foreign investors, leading to elevated investor risk; economic nationalism has led to promoting national champions at the expense of investment more broadly. In Turkey, defiance of macro-economic orthodoxy has been a handmaiden of political authoritarianism. In Ethiopia, a Nobel peace prize and an industrialization boom gave way to a bloody civil war and a fiscal crisis. Across the Sahel's "coup belt", military takeovers in Mali, Niger, and Burkina Faso have come with economic volatility, withdrawal from regional trading blocs, and fiscal contraction in the face of lost aid revenue. Not all of these connections are causal, but a combination of declining trading opportunities externally and deteriorating institutions domestically is a cocktail that is not conducive for long-run economic growth.
The data series we analyze here stop in 2023, well before Donald Trump's "liberation day" ratcheted up tariffs in the world's largest importer to levels not seen since the Great Depression. In the wake of that tariff announcement in April, the IMF quickly revised its global growth forecast for 2025 down by about half a percentage point. But the immediate impact of this policy shock on income gaps between rich and poor countries is technically ambiguous: the IMF's downward revision for advanced and emerging markets was the same, and largest for the U.S. at -0.9%. Nevertheless, if we're right that hyperglobalization and the spread of liberal democratic norms were catalysts for economic convergence between the fall of the Berlin Wall and the Global Financial Crisis, we see little reason to hope that the world's poorest countries will fare well in this new era of political and economic nationalism. A falling tide is unlikely to lift the flimsiest boats.
--